Analytics
The Analytics page reports on searches, result clicks, purchases, searches that returned nothing, and the sales VIBE helped create.
The page combines anonymous storefront activity with the minimum paid-order line information needed to connect sales to VIBE activity. VIBE does not show shopper identity in Analytics.
What you can do here
Section titled “What you can do here”- Pick a date range and see how search performed.
- See which searches led to clicks, carts, and sales.
- Find searches that returned nothing.
- See your top queries and products, and where you have room to improve.
Choosing a date range
Section titled “Choosing a date range”The range selector offers Last 7 days, Last 30 days, and Last 90 days. Each range is compared with the period right before it, of the same length.
Figures come from a daily total that updates during the day, so very recent activity may not show up yet.
The four tabs
Section titled “The four tabs”Starter shows the Overview tab only. Growth, Pro, and Enterprise also show Engagement, Attribution, and Search insights.
Overview
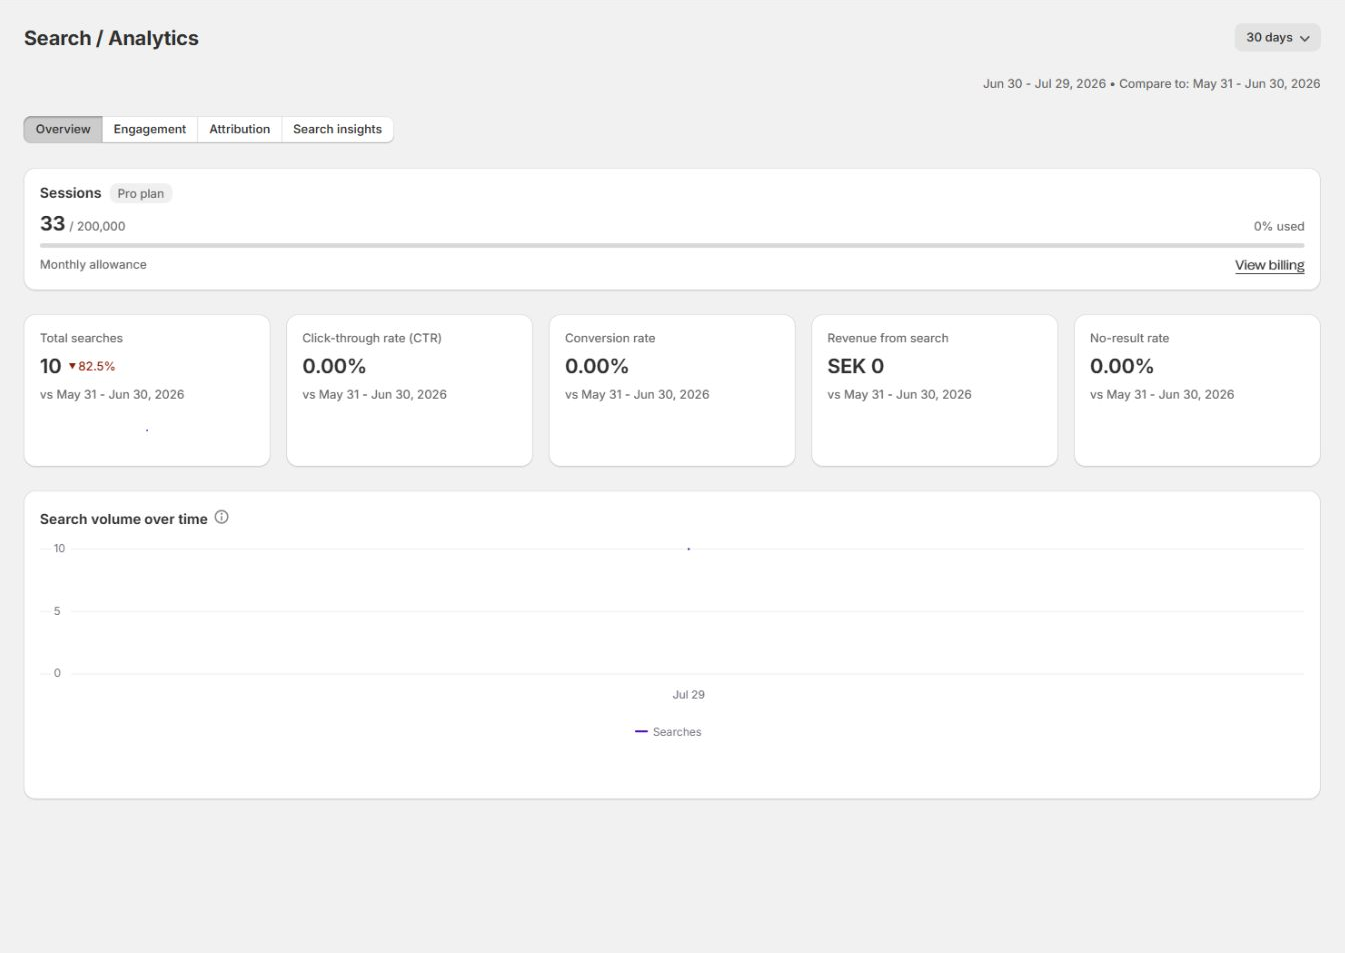
Section titled “Overview”Use Overview for a quick health check:
- Shopper visits used this month.
- Total searches.
- Click-through rate.
- Conversion rate.
- Revenue from search.
- No-result rate.
- Search volume over time, on plans with advanced analytics.
Start here when a number has changed and you need to decide which detailed tab to check next.
Engagement
Section titled “Engagement”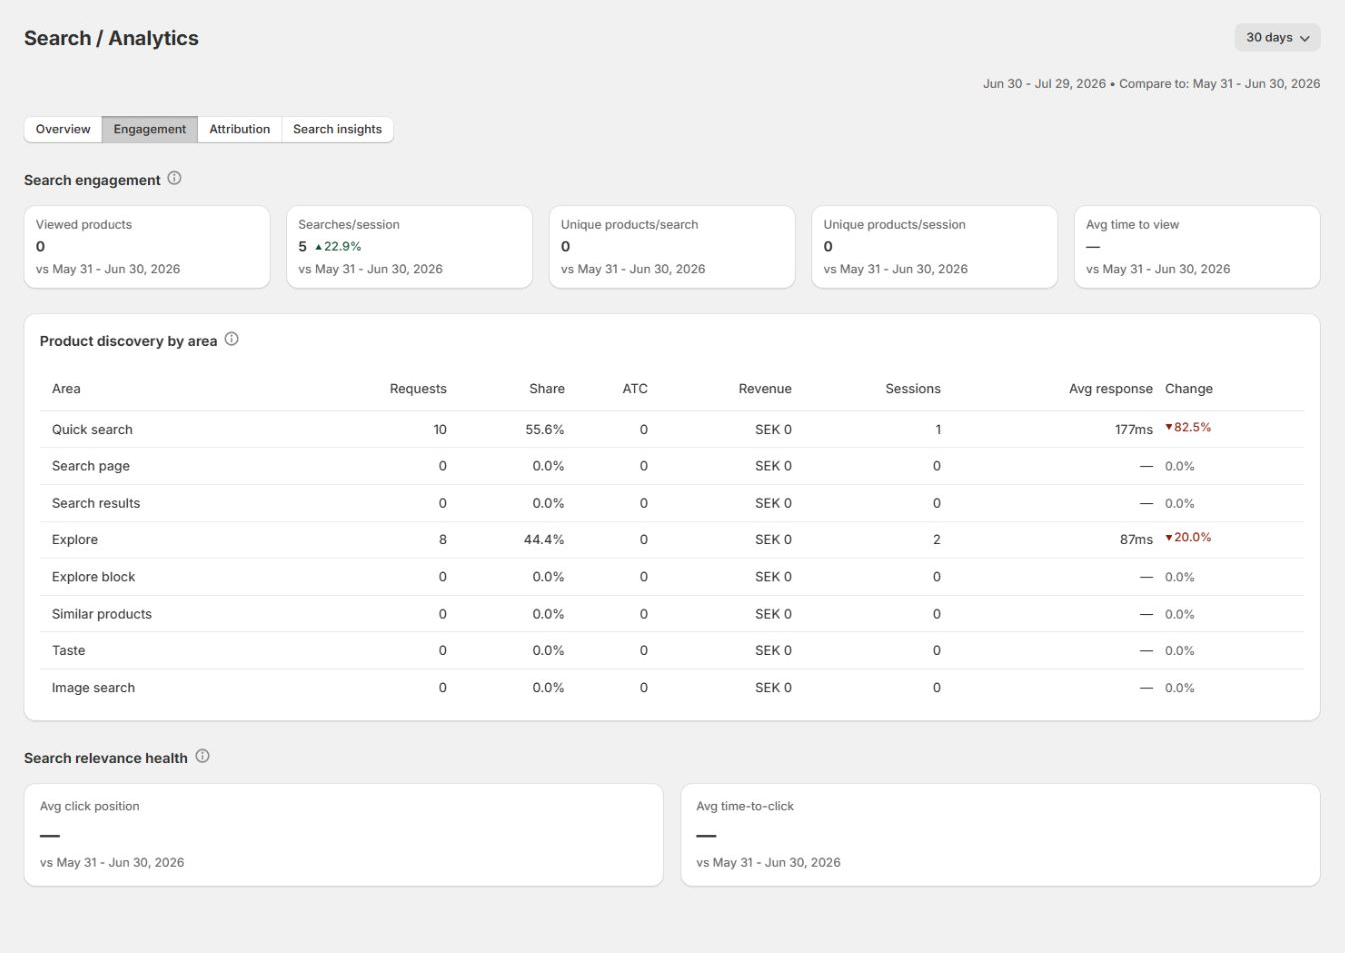
Use Engagement to understand how shoppers interact with your results:
- Viewed products counts distinct products shoppers viewed after finding them through search or Explore.
- Searches/session shows how often a shopper visit that includes a search repeats that search.
- Unique products/search shows how many different products a single search leads shoppers to view.
- Unique products/session shows how many different products get viewed across one shopper visit.
- Avg time to view is the average time between a search and a shopper opening a product.
- Product discovery by area splits activity across storefront surfaces (Quick search, Search page, Explore, and more) and reports requests, share, cart adds, revenue, Sessions (shopper visits), response time, and change.
- Search relevance health reports two measures, both where lower is better: average click position (how far down the results a shopper had to scroll before clicking) and average time to click (how long it took them to click something).
Use this tab after a relevance, layout, or navigation change. For what’s healthy and what to do when one of these looks off, see Use Engagement to locate friction in Measure and optimize search.
Attribution
Section titled “Attribution”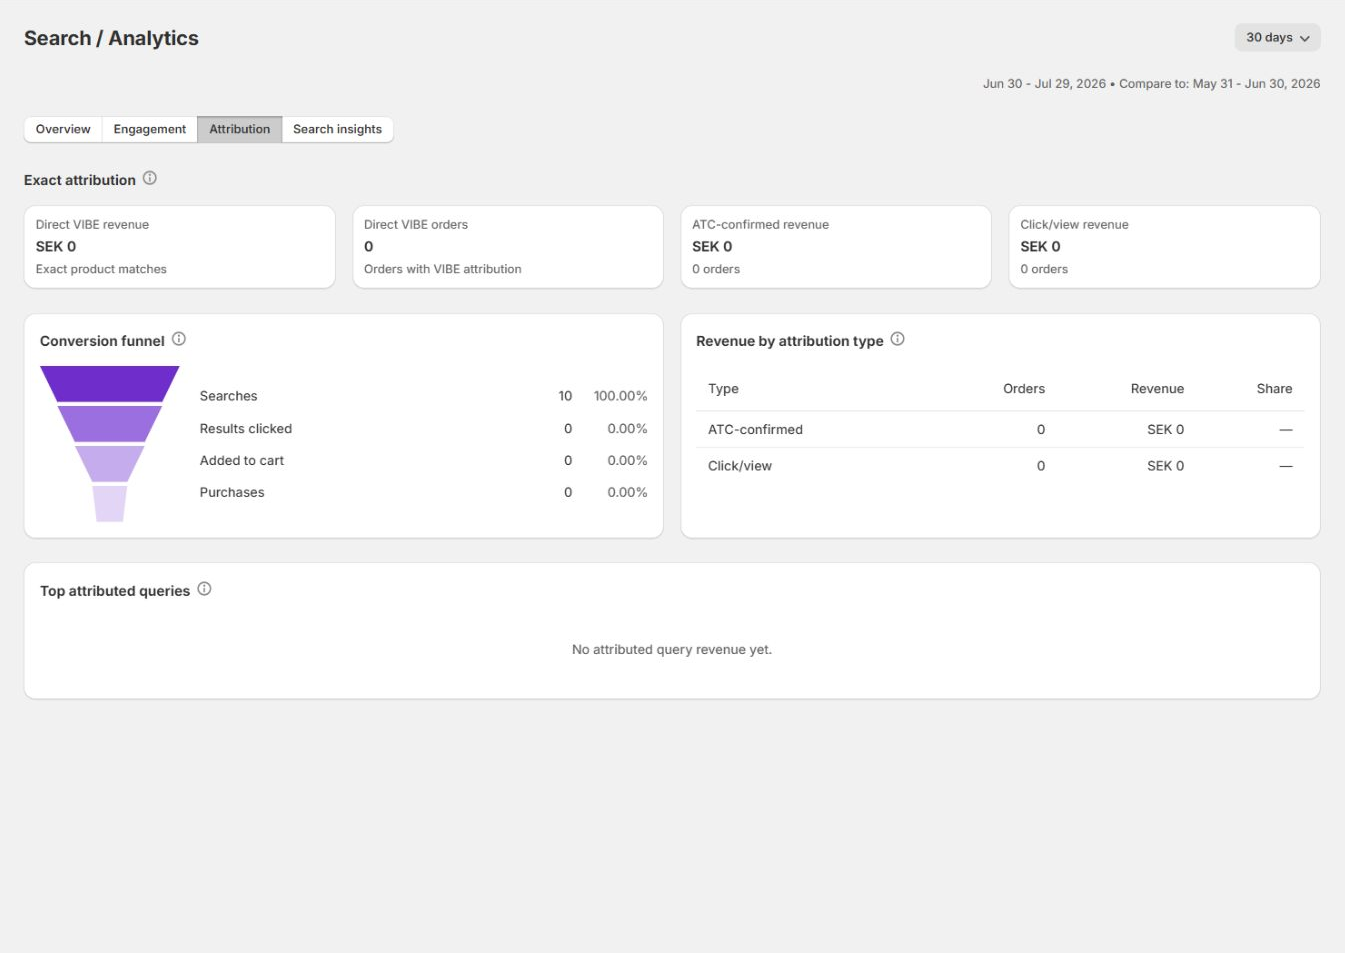
Use Attribution to see the orders and revenue tied to search and Explore:
- Direct VIBE revenue and Direct VIBE orders count sales where VIBE can point to the exact product a shopper clicked. While raw events are retained, an order counts once across the whole selected range, even if its matching products trace to different UTC days. Older ranges are labeled daily distinct because they sum each day’s unique orders, so the same order can count once on each matching day.
- Distinct order sessions counts anonymous shopper visits with at least one order directly matched to VIBE activity. A visit counts once across products and orders in a range while raw events are retained. For older ranges, the card is labeled Daily distinct order sessions because it sums each day’s anonymous distinct count.
VIBE hides the period-over-period order trend when one range counts unique orders across the whole range and the other adds up daily unique orders, because those counts are not directly comparable. If an older range contains matched orders from before VIBE counted visits with orders, that visit count appears as unavailable rather than zero. Expired anonymous visit identifiers cannot be recovered by later updates.
- ATC-confirmed revenue is backed by a matching add-to-cart.
- Click/view revenue is backed by a result click or a product view.
- Shopify/control revenue appears when a shopper in the A/B test’s control group (seeing Shopify’s native search) still has activity VIBE can measure.
- Conversion funnel shows searches, result clicks, cart adds, and purchases.
- Revenue by attribution type splits product-line revenue matched to VIBE by the matching signal. If different products in one order use different signals, that order appears in both subtype counts, so ATC-confirmed and click/view order counts can overlap.
- Top attributed queries lists the searches that led to the most orders and revenue. Its order column sums daily-distinct counts from bounded rollups, so one order tied to the same query on multiple UTC days can count once per day.
Use this tab to separate search activity from the sales it actually helped create. For what’s healthy and what to do when one of these looks off, see Use Attribution carefully in Measure and optimize search.
Search insights
Section titled “Search insights”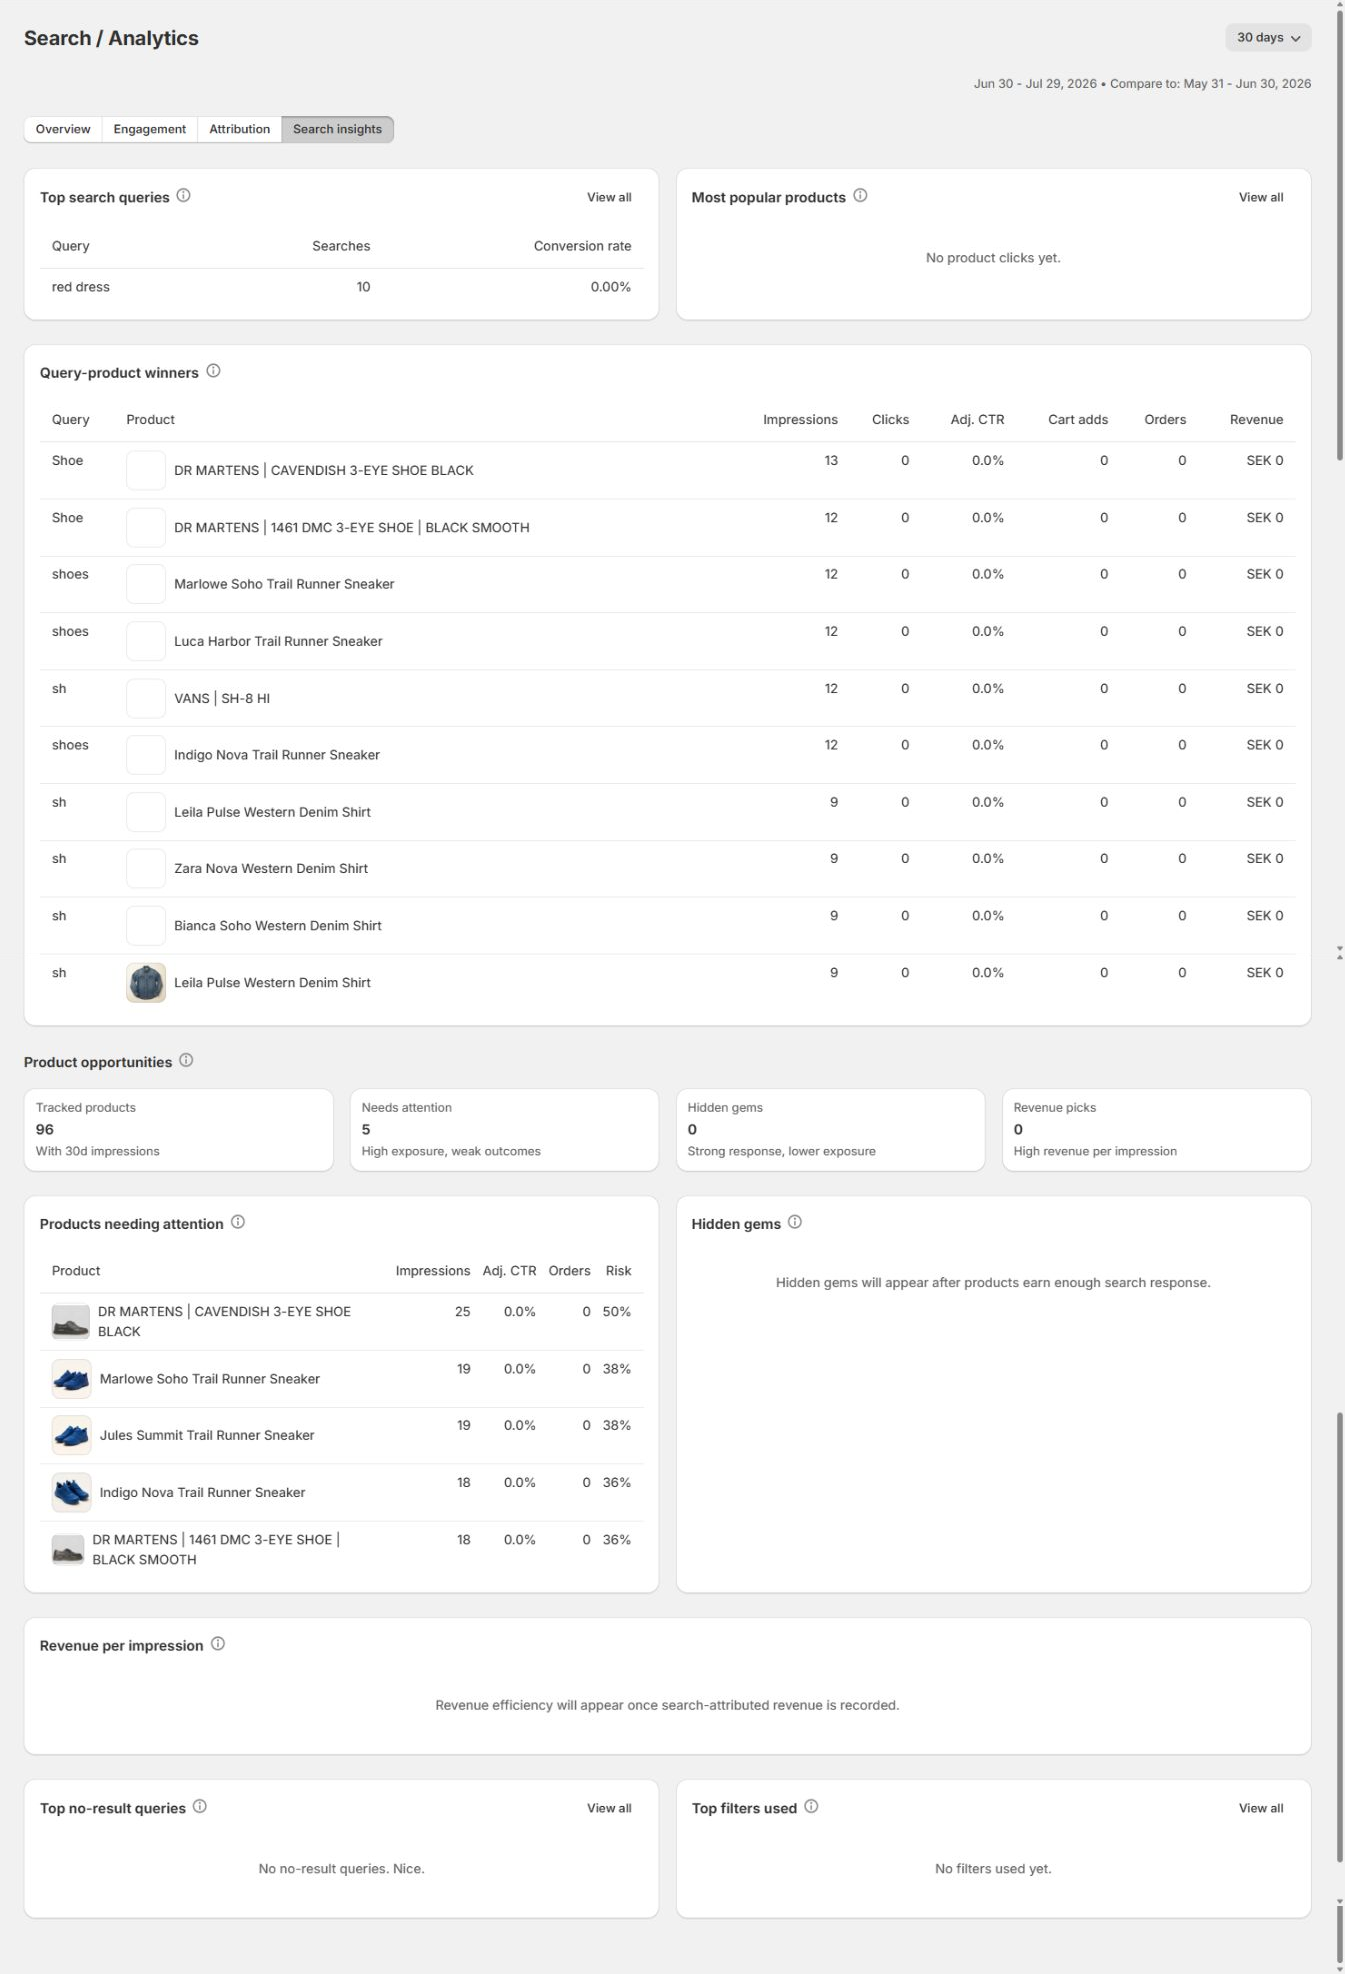
Use Search insights to decide what to change:
- Top search queries.
- Most popular products.
- Query-product winners.
- Products needing attention.
- Hidden gems.
- Revenue per impression.
- Top no-result queries.
- Top filters used.
These tables need enough impressions and a day or two of daily totals to fill in. An empty table can just mean your store doesn’t have enough activity yet.
The metric cards
Section titled “The metric cards”Five summary cards sit at the top of Overview. Each shows the value for your selected range, the change against the period before it, and a small trend line.
- Total searches counts every search a shopper ran in the range. A healthy count moves with your traffic and marketing, not on its own. If it looks off, compare it with your overall site traffic: steady traffic with a falling search count can mean shoppers aren’t finding the search box.
- Click-through rate (CTR) is the share of searches that led to a product click, calculated as result clicks divided by total searches (its change is shown in percentage points). A healthy CTR holds steady or rises after a relevance improvement. If it drops, check whether shoppers are seeing results near the top that match what they typed.
- Conversion rate is the share of searches that led to a purchase VIBE can trace back to that search. A conversion is a search click later matched to a paid order (see How VIBE connects search to a sale below). A healthy rate is stable or improving over time. If it drops, check whether clicks and cart adds are still happening in the funnel before assuming search is the cause.
- Revenue from search is the order revenue VIBE traced back to search clicks in the range. A healthy trend tracks your overall sales. If it looks low, remember the most recent day or two is still filling in (see below).
- No-result rate is the share of searches that returned nothing. Lower is better, so the card treats a decrease as a positive change. If it rises, that’s your cue to open the Top no-result queries table and see what shoppers are searching for that you don’t seem to have.
Shopper visits used this month
Section titled “Shopper visits used this month”Every plan includes a monthly number of shopper visits. The VIBE admin calls each one a session, and the Sessions card on this page shows your billing usage for the current month: visits used against your plan’s monthly allowance, a percentage bar, your plan name, and a link to billing. VIBE counts a visit as soon as it loads for a real shopper on your storefront, not only when they search or use Explore. Further searches, clicks, and cart adds during that same visit don’t add to the count. Going over your allowance can add extra charges on paid plans. Your Plan and billing page has the exact allowance and rate for your plan.
Charts and tables
Section titled “Charts and tables”- Search volume over time is a line chart of total searches per day across the range.
- Conversion funnel shows how searches progress toward a purchase, each stage as a count and as a share of total searches: Searches, Results clicked, Added to cart, and Purchases.
- Top search queries lists your most-searched phrases, with the number of searches and a conversion rate for each. Different capitalizations of the same phrase are grouped together.
- Most popular products lists the products clicked most often from search, with title and image where VIBE can match them to your catalog.
- Top no-result queries lists searches that returned nothing, with how often each ran and its share of all searches. Use it to find missing products, wording gaps, or catalog gaps.
- Top filters used lists the storefront filters shoppers apply most when narrowing down results.
- Search relevance health has the same two measures described under Engagement above: average click position and average time to click. Both are healthier when lower.
How VIBE connects search to a sale
Section titled “How VIBE connects search to a sale”VIBE connects search to sales by matching a click to a later order:
- A shopper runs a search and clicks a product in the results.
- If a paid order for that product arrives within 30 days of the click, VIBE counts that click as converted and credits that order line’s revenue to it, not the whole order.
- That revenue and conversion roll up into Revenue from search, Conversion rate, and the funnel.
VIBE only counts revenue after Shopify marks the order paid, and each click can only count once. A product-line refund reduces the matched line revenue. When every matched line is fully refunded, or Shopify cancels the order, VIBE removes the conversion. Shipping-only refunds do not change product-search revenue.
Refund and cancellation corrections are available while the matched source search event is retained (90 days). After that source record is permanently deleted, its daily report remains only as an anonymous aggregate with no order identifier, so VIBE cannot connect a later refund or cancellation back to that historical day. Use Shopify’s order reports when reconciling older periods.
Because a paid order can match a click from the previous 30 days, revenue and conversion figures can change after the interaction date. VIBE refreshes the affected day when a paid order, product-line refund, or cancellation is processed. Use Shopify’s order report alongside VIBE when reconciling a period that still contains unsettled orders.
What requires an upgrade
Section titled “What requires an upgrade”Analytics comes in two tiers. Basic analytics is available on every active plan. Advanced analytics is available on Growth, Pro, and Enterprise. On a plan without advanced analytics, the page shows Overview with an upgrade note.
| Capability | Starter | Growth | Pro | Enterprise |
|---|---|---|---|---|
| Overview | Yes | Yes | Yes | Yes |
| Engagement | No | Yes | Yes | Yes |
| Attribution | No | Yes | Yes | Yes |
| Search insights | No | Yes | Yes | Yes |
Some tables also depend on activity from another feature. Top filters used needs storefront filtering turned on. The query-product and product-opportunity tables need enough product views and outcomes to say anything useful.
Reading the dashboard
Section titled “Reading the dashboard”- Watch the no-result rate, then use Top no-result queries to find missing products or terms shoppers expect you to have.
- Compare the change against the previous period, not just the current value, to see whether a number is actually trending.
- Check relevance health after a big catalog change. A jump in average click position can mean the most relevant items aren’t surfacing near the top anymore.
- Give revenue a day or two to settle before you judge it; VIBE keeps matching new orders to recent clicks during that window.
Recipe: fix your top no-result query
Section titled “Recipe: fix your top no-result query”- Open Analytics and find the Top no-result queries table.
- Note the query shoppers ran most that returned nothing.
- Decide the cause. If you stock something for it, the product may not be in VIBE’s copy of your catalog, or it may be excluded, so check Sync and index. If the wording is the gap, add a synonym rule mapping that query to the right words. If you genuinely don’t stock it, that’s a product opportunity worth noting.
- Check the table again over the next few days to confirm the count drops.
Troubleshooting
Section titled “Troubleshooting”Revenue from search shows zero or looks low. VIBE only counts revenue after an order is marked paid, and it can match that order to a search click from the previous 30 days. VIBE also needs permission to read your orders, and analytics plus marketing consent must have allowed the anonymous tracking ID to reach the cart. If figures stay flat over a longer period with healthy search volume, check whether searches are leading to clicks and confirmed cart adds in the funnel.
My no-result rate went up. What should I do? Open Top no-result queries and check for missing products, products that haven’t made it into VIBE’s copy of your catalog yet, or wording that needs a synonym.
Why don’t I see the advanced charts? Advanced analytics is available on Growth, Pro, and Enterprise. Starter shows Overview with a note about upgrading. See Plan and billing.
A detailed table is empty but the headline cards have data. The detailed product and query tables each need their own minimum activity and a day or two of daily totals. Keep collecting real storefront activity, and confirm your selected date range includes it.
If something looks wrong beyond what’s covered here, see Diagnose search and storefront problems.
For the full technical detail behind these numbers, from what counts as a visit to exactly how a sale gets matched, see Privacy, shopper visits, and sales tracking.