Measure and optimize search
Search improvement works best as a loop: watch, diagnose, change one thing, verify, and measure. Avoid changing how VIBE reads your products, your theme, your controls, and your rules all at the same time. If you change everything at once, you won’t be able to tell what actually caused the result.
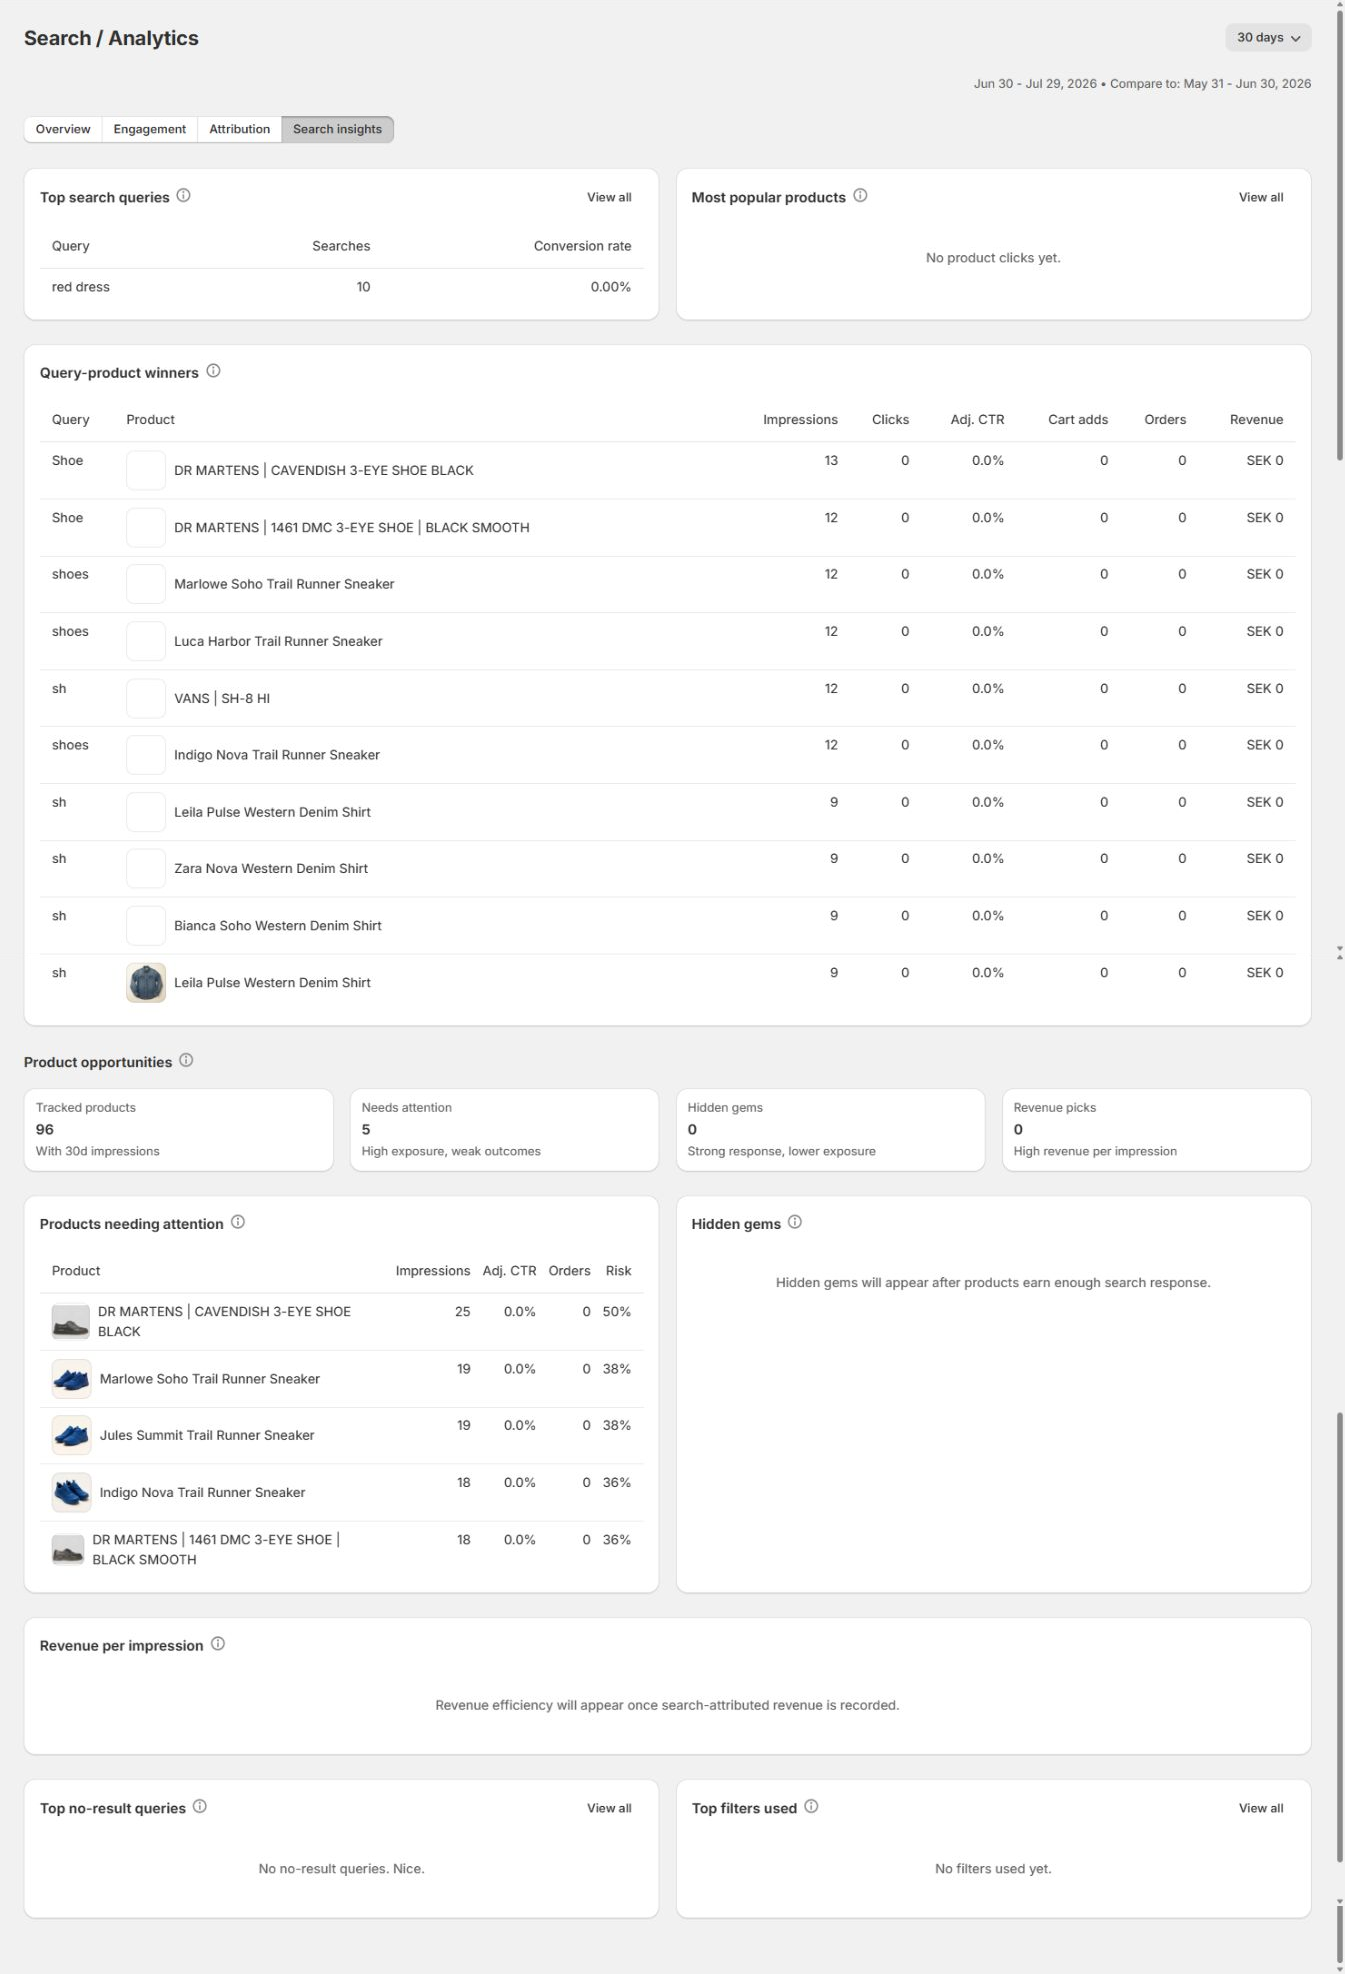
Analytics identifies the problem worth investigating.
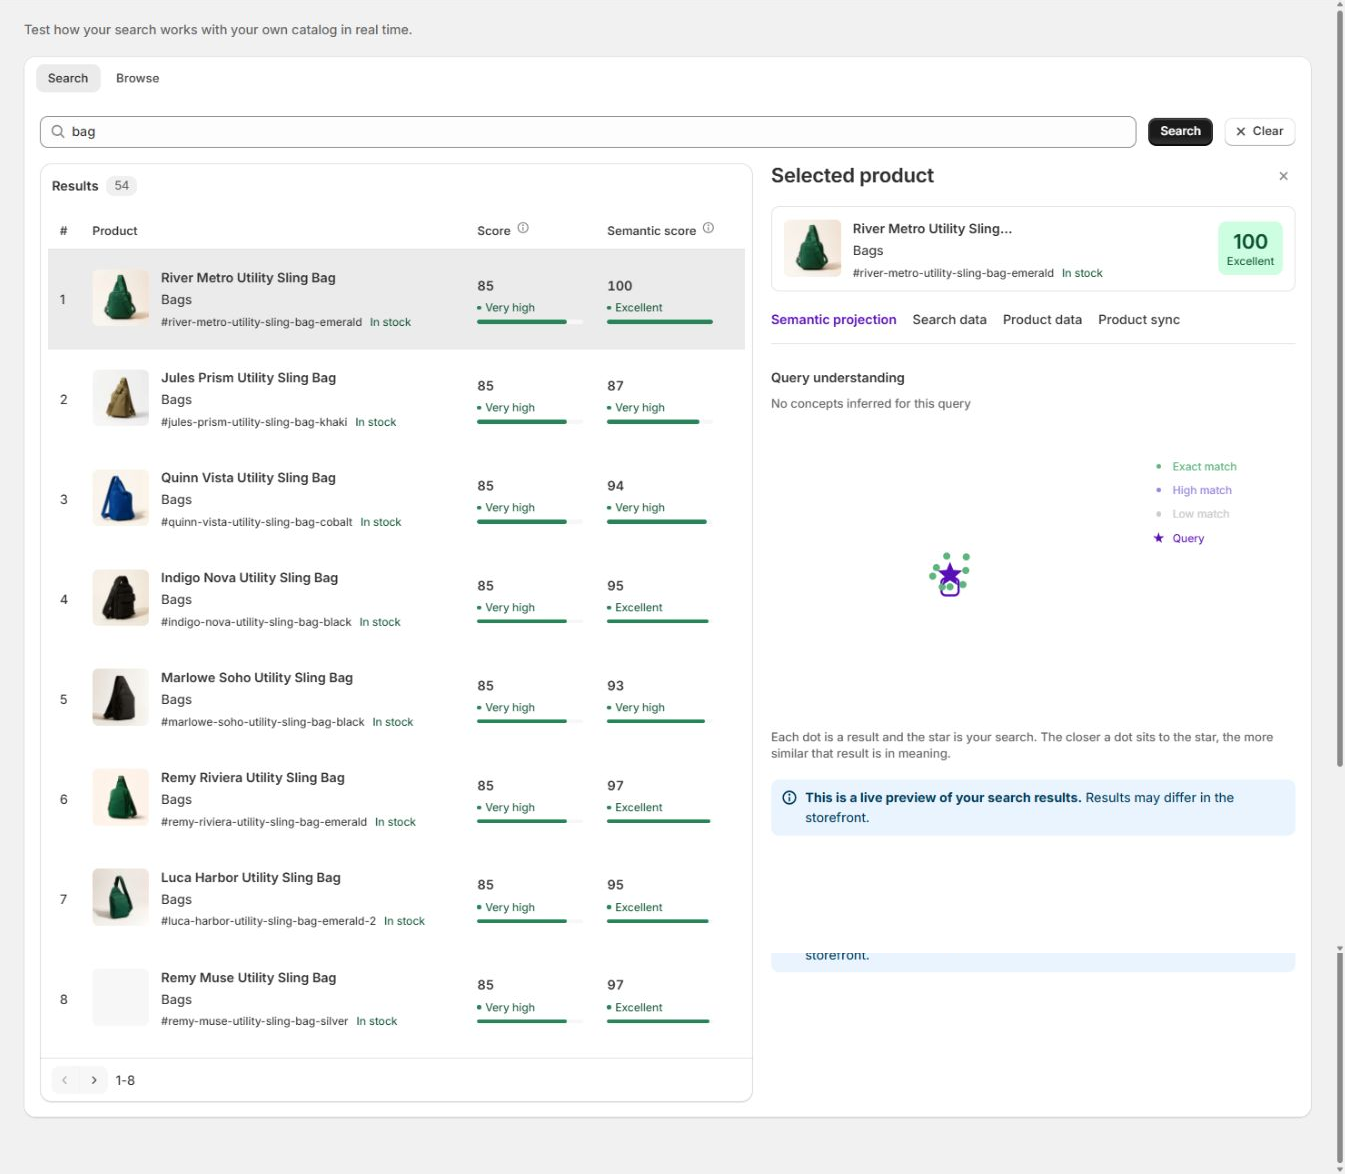
Preview helps you understand a result before you change anything live.
Set an operating cadence
Section titled “Set an operating cadence”Daily during launch or a major campaign
Section titled “Daily during launch or a major campaign”- Confirm search is live.
- Check Sync and Index for a failed or partial job.
- Check the Help page for any systems reporting a problem.
- Run the campaign’s highest-value queries.
- Confirm campaign rules and redirects are active.
- Check mobile quick search and the full search page.
Weekly during normal operation
Section titled “Weekly during normal operation”- Review Home.
- Check your shopper visits used this month, and any traffic you’re expecting soon.
- Open Analytics for the last 30 days.
- Review Search insights.
- Select one high-value problem.
- Reproduce it in Preview.
- Make one targeted change.
- Test it on your storefront.
- Record the date, the reason, and the metric you expect to move.
How to check it worked: you end the week having taken one specific action and written down what you expect to change, not just a list of numbers you looked at.
Monthly
Section titled “Monthly”- Compare 30-day and 90-day trends.
- Review how VIBE reads your products, and your overall catalog health.
- Remove result rules and redirects you no longer need.
- Review how much your Explore controls and filters get used.
- Review product opportunities.
- Confirm your plan usage and limits.
- Review any theme and translation changes.
- Decide whether your store is ready for an A/B test.
Start with a question
Section titled “Start with a question”Don’t browse charts without a decision in mind. Good operating questions include:
- Which high-volume queries return no products?
- Which important queries have weak click-through?
- Are shoppers finding relevant products near the top?
- Which discovery surface produces carts or revenue?
- Which filters and controls are actually used?
- Which products get seen but sell weakly?
- Which products perform well despite low exposure?
- Did a change you made actually improve what you intended?
Read Overview as a health check
Section titled “Read Overview as a health check”Total searches
Section titled “Total searches”Use it to understand demand and traffic. A change can reflect seasonality, marketing, site traffic, or how many shoppers are using search at all. It doesn’t measure relevance by itself.
Click-through rate
Section titled “Click-through rate”CTR is the share of searches that led to a product click.
Investigate a decline with:
- Average click position.
- Time to click.
- No-result rate.
- Which queries shoppers are running.
- How product cards are presented.
- Filter and control behavior.
Conversion rate
Section titled “Conversion rate”Conversion rate connects search with the sales VIBE could trace back to it. It can change because of search quality, price, inventory, checkout, traffic quality, promotions, or how long it takes VIBE to match a sale to a search.
Revenue from search
Section titled “Revenue from search”Use Attribution to see how much revenue search helped create.
Attribution breaks out direct VIBE, cart-add-confirmed, click/view, and control revenue separately. Compare definitions and time windows carefully before comparing these figures with another analytics tool.
No-result rate
Section titled “No-result rate”Lower is normally better, but a small number of honest no-result searches can be healthier than returning irrelevant products for everything.
Use the query table to work out whether the cause is:
- Product not in VIBE’s copy of your catalog.
- Product not stocked.
- Shopper wording your catalog doesn’t use.
- Typo or missing synonym.
- A collection or variant your store doesn’t support.
- A query that should redirect to content instead of results.
Use Engagement to locate friction
Section titled “Use Engagement to locate friction”Viewed products
Section titled “Viewed products”Shows the breadth of products shoppers reach through discovery. A rise can mean shoppers are exploring more, but it can also mean they need more clicks to find the right item. Read it alongside time to view and conversion.
Searches per visit
Section titled “Searches per visit”A moderate repeat rate can be healthy refinement. A sharp increase paired with weak clicks can mean shoppers are repeatedly retrying a search that isn’t working for them.
Unique products, per search and per visit
Section titled “Unique products, per search and per visit”These show discovery breadth. Use them after adding Explore, collections, filters, or visual discovery.
Average time to view
Section titled “Average time to view”Lower is normally better. A rise can point to slower response times, unclear cards, low relevance, or more complex browsing.
Product discovery by area
Section titled “Product discovery by area”Compare Quick search, Search page, Explore, Similar, Taste, and any other surfaces reported.
For each area, review:
- Requests and share.
- Cart adds and revenue.
- Shopper visits.
- Average response time.
- Change against the previous period.
Don’t turn off a low-volume surface until you understand whether it serves a smaller but high-value group of shoppers.
Average click position
Section titled “Average click position”Lower means shoppers usually click nearer the top. Track it after a change to how VIBE reads your products, your catalog, or your ranking.
Average time-to-click
Section titled “Average time-to-click”Lower suggests shoppers recognize the useful result faster.
A theme card redesign can change average time-to-click even when ranking hasn’t changed at all.
Use Attribution carefully
Section titled “Use Attribution carefully”The conversion funnel is:
- Searches.
- Results clicked.
- Added to cart.
- Purchases.
Find the largest unexpected drop.
| Drop | Investigate |
|---|---|
| Search to click | Relevance, no results, cards, response time |
| Click to cart | Product fit, price, availability, product page, selected variant |
| Cart to purchase | Checkout and commercial factors beyond search |
VIBE matches a paid order to a search click after the order comes in, not the moment the click happens. Avoid judging the most recent day’s numbers before orders have had time to settle.
Use Search insights to choose work
Section titled “Use Search insights to choose work”Top search queries
Section titled “Top search queries”Prioritize terms with both high volume and commercial importance. A low-volume query can still matter when it represents a high-value product or a need your best customers have.
Query-product winners
Section titled “Query-product winners”These are products with a strong response to a specific query. Use them as evidence for natural ranking or a shopper-behavior rule, not as a reason to pin every winning product.
Products needing attention
Section titled “Products needing attention”These products get seen but convert weakly on clicks, orders, or revenue.
Check:
- Is the product actually relevant to the queries showing it?
- Is the card image or title clear?
- Is the price or availability competitive?
- Is a rule overexposing it?
Hidden gems
Section titled “Hidden gems”These products perform well despite low exposure. Consider improving their source data, adding a scoped boost, featuring their collection, or using them in a campaign.
Revenue per impression
Section titled “Revenue per impression”This measures how much revenue you get for the exposure a product gets. Use it alongside absolute volume, so one high-value order doesn’t dominate a tiny sample.
Top filters used
Section titled “Top filters used”High use shows shopper demand for exact narrowing. Confirm the filter values are clean and that mobile filter access is easy.
Improvement decision tree
Section titled “Improvement decision tree”Product absent
Section titled “Product absent”Make sure the product can be shown, and that it’s in VIBE’s copy of your catalog.
Product present but broadly misunderstood
Section titled “Product present but broadly misunderstood”Improve your Shopify product data, or how VIBE reads your products.
Equivalent shopper word is missing
Section titled “Equivalent shopper word is missing”Add a synonym.
One campaign needs business priority
Section titled “One campaign needs business priority”Use a scoped boost, bury, pin, or redirect.
Preference-based browsing is difficult
Section titled “Preference-based browsing is difficult”Improve your Explore controls and starting collections.
Factual narrowing is difficult
Section titled “Factual narrowing is difficult”Improve your Shopify filters and structured values.
Cards do not communicate the result
Section titled “Cards do not communicate the result”Improve your theme or VIBE’s presentation without changing ranking.
Change log template
Section titled “Change log template”For every real change you make, record:
- Date and owner.
- Store and theme.
- Exact problem.
- Evidence and date range.
- Affected query, product, surface, or audience.
- What you changed.
- Why you chose this layer to change.
- Preview result.
- Storefront QA result.
- Expected metric and review date.
- How to roll it back.
This keeps old campaign rules and unexplained changes from piling up.
When to use an A/B test
Section titled “When to use an A/B test”Run a test when:
- VIBE’s copy of your catalog is healthy and current.
- Your setup is stable.
- Your major rules and controls are stable.
- Your store has enough traffic.
- You want to compare VIBE against Shopify’s native search.
Don’t use an A/B test to diagnose a broken setup or catalog data you already know is missing.
During the test:
- Avoid publishing a new theme.
- Avoid broad changes to how VIBE reads your products.
- Avoid launching a major set of new result rules unless they affect both groups fairly.
- Review both groups, not just one headline number.
- Let the test run to its normal end, unless something is actively harming shoppers.
After the test, record the test period, the traffic context, any major store events, and the full metric table.
Avoid false conclusions
Section titled “Avoid false conclusions”- Correlation isn’t proof of causation.
- A metric can move because your traffic mix changed.
- A small sample can produce large percentages.
- Revenue can lag behind searches.
- Averages can hide a few high-volume problem queries.
- A rule can improve one query while hurting another.
- A theme change can affect click behavior without changing ranking.
- An inventory event can affect conversion without search changing at all.
Use exact query and product evidence alongside the aggregate numbers.
If something looks wrong beyond what these guides cover, see Diagnose search and storefront problems.